

Running an appointment-driven business feels like conducting an orchestra where half the musicians can't see your baton. You've got stylists managing their own books, front desk juggling walk-ins, clients ghosting appointments, and somehow you're supposed to know if everything's working smoothly. Most owners don't realize their operation is bleeding money until they check their bank statement at month-end.
The problem isn't that appointment businesses lack data. Modern booking platforms track everything. The problem is that raw booking numbers don't tell you what's actually broken. A 15% no-show rate means something completely different for a medical practice versus a hair salon versus a consulting firm. Without operational context, you're just staring at spreadsheets hoping patterns emerge.
What appointment-driven businesses actually need is an operational monitoring framework that connects booking metrics to real business outcomes. Not generic KPIs lifted from a business textbook — operational definitions that match how your specific business actually runs, threshold alerts calibrated to your real capacity, and clear playbooks for when things drift outside normal ranges.
The hidden complexity of appointment operations
Every appointment business thinks their scheduling challenges are unique. A dental practice complains about last-minute cancellations. A therapy clinic struggles with therapist utilization. A salon can't figure out why Saturdays feel chaotic despite being "fully booked."
These aren't separate problems. They're symptoms of the same operational blindness.
Take a typical day at a moderately busy hair salon. The schedule shows 85% booked, which sounds healthy. But dig into the actual operation: three stylists called out sick this month, forcing 47 client reschedules. The newest stylist has 40% availability but only books 20% because clients don't know she exists. Your top performer is burnt out from being triple-booked every Saturday while Tuesday afternoons sit empty. The front desk manually texts appointment reminders and misses about 30% of clients. No-shows cluster around certain services but nobody tracks which ones.
The owner sees "85% booked" and thinks things are fine. Meanwhile, the operation hemorrhages profit through a thousand small leaks.
This pattern repeats across every appointment-driven vertical. Medical practices lose $150 per no-show but don't track no-show patterns by provider, time slot, or appointment type. Consulting firms bill at 60% utilization thinking that's normal, not realizing their scheduling chaos costs them 20 percentage points. Fitness studios pack morning classes while afternoon slots die, but they optimize marketing instead of addressing the scheduling imbalance.
The core issue: appointment businesses treat scheduling as an administrative task rather than an operational system. They monitor vanity metrics like total bookings instead of operational health indicators that actually predict profit.
Building your operational monitoring stack
Forget everything you've heard about "industry-standard KPIs." Your massage therapy practice doesn't need the same metrics as a dental office. What you need is a monitoring framework built around your specific operational reality.
Eliminate scheduling conflicts and missed meetings.
Schedily helps you organize and manage all appointments and team availability effortlessly.
- Unified appointment and resource management
- Automated notifications & reminders
- Team calendar synchronization
No credit card required
Start with understanding your business's actual operational flow. Not the idealized version from your business plan — how appointments actually move through your system day to day.
Core operational metrics that actually matter
Revenue per Available Hour (RevPAH)
This isn't just total revenue divided by hours open. It's revenue generated divided by actual service capacity. A salon with 5 stylists working 8 hours has 40 available service hours, not 8 business hours.
Calculation:
``sql
SELECT
DATETRUNC('week', appointmentdate) as week,
SUM(servicerevenue) / SUM(availablehours) as revpah
FROM appointments
JOIN providerschedules ON ...
WHERE appointmentstatus = 'completed'
GROUP BY week
``
Set thresholds based on your cost structure. If you need $55 RevPAH to break even and you're running at $48, you're slowly drowning even if revenue looks stable month to month.
Utilization by Time Block
Raw utilization percentages hide massive operational problems. You need utilization broken down by meaningful time blocks that match your business rhythm.
| Time Block | Utilization |
|---|---|
| Early morning (7–9am) | 45% |
| Peak morning (9–12pm) | 92% |
| Lunch block (12–2pm) | 30% |
| Afternoon (2–5pm) | 78% |
| Evening (5–7pm) | 22% |
That 92% peak morning utilization means you're turning away profitable procedures. The 22% evening utilization suggests you should probably cut those hours or staff them differently.
Client Lifetime Appointment Value (CLAV)
Not lifetime revenue — lifetime appointments. How many times does a client book before they disappear? This metric predicts future capacity needs better than any growth projection.
| Source | Avg. Appointments |
|---|---|
| Google Ads clients | 3.2 |
| Referrals | 8.7 |
| Walk-ins | 1.8 |
When CLAV drops, you don't have a marketing problem. You have a retention problem that marketing can't fix.
No-Show Cost Impact
Everyone tracks no-show rates. Almost nobody tracks no-show cost impact. A 10% no-show rate for $30 haircuts hurts less than a 5% no-show rate for $300 color corrections.
Build a weighted no-show metric:
``sql
SELECT
servicetype,
COUNT() as noshows,
AVG(serviceprice) as avgprice,
COUNT() * AVG(serviceprice) as revenueimpact
FROM appointments
WHERE status = 'no-show'
AND appointmentdate > CURRENTDATE - 30
GROUP BY servicetype
ORDER BY revenueimpact DESC
``
This tells you which no-shows actually matter to your bottom line.
Threshold alerts that prevent fires
Progressive No-Show Thresholds
-
Individual client
2 no-shows in 60 days → flag for deposit requirement
-
Service type
15% no-show rate → review booking requirements
-
Time slot
20% no-show rate → consider overbooking or policy change
-
Provider
25% no-show rate → investigate provider-specific issues
Each threshold triggers a different response, not just a notification.
Utilization Bands by Day Pattern
Monday utilization dropping from 70% to 65% might be normal variation. Saturday utilization dropping from 95% to 90% is a different story.
-
Monday–Tuesday
Alert below 60% or above 85%
-
Wednesday–Thursday
Alert below 70% or above 90%
-
Friday–Saturday
Alert below 85%
Above-threshold alerts matter too. Consistent 95%+ utilization means you're leaving money on the table through capacity constraints.
Booking Velocity Tracking
-
Same-day bookings
Usually desperation or cancellation fills
-
Next-day
Urgent needs
-
3–7 days out
Standard planning
-
2+ weeks
Advance planners
When velocity patterns shift, something changed in your market or operation:
``sql
SELECT
DATEPART('day', appointmentdate - bookingdate) as daysadvance,
COUNT(*) as bookings,
AVG(serviceprice) as avgvalue
FROM appointments
WHERE bookingdate > CURRENTDATE - 7
GROUP BY days_advance
``
Dashboard architecture that actually gets used
Daily Operations Dashboard
-
Today's schedule fill rate
-
No-shows in last 2 hours
-
Tomorrow's open slots by provider
-
Wait list count
-
Current day RevPAH vs target
Keep it on a mounted tablet or second monitor. Update every 15 minutes.
Weekly Management View
-
Week-over-week utilization trends
-
Provider utilization rankings
-
No-show patterns by day/time
-
Revenue per provider hour
-
Booking source performance
This drives scheduling decisions and staff allocation.
Monthly Strategic View
-
Capacity utilization trends
-
Client retention cohorts
-
Service mix evolution
-
Provider productivity trends
-
Seasonal pattern recognition
This is where you decide when to hire, which services to promote, and where operations need adjustment.
Here's a simple workflow to monitor appointments and trigger playbooks.
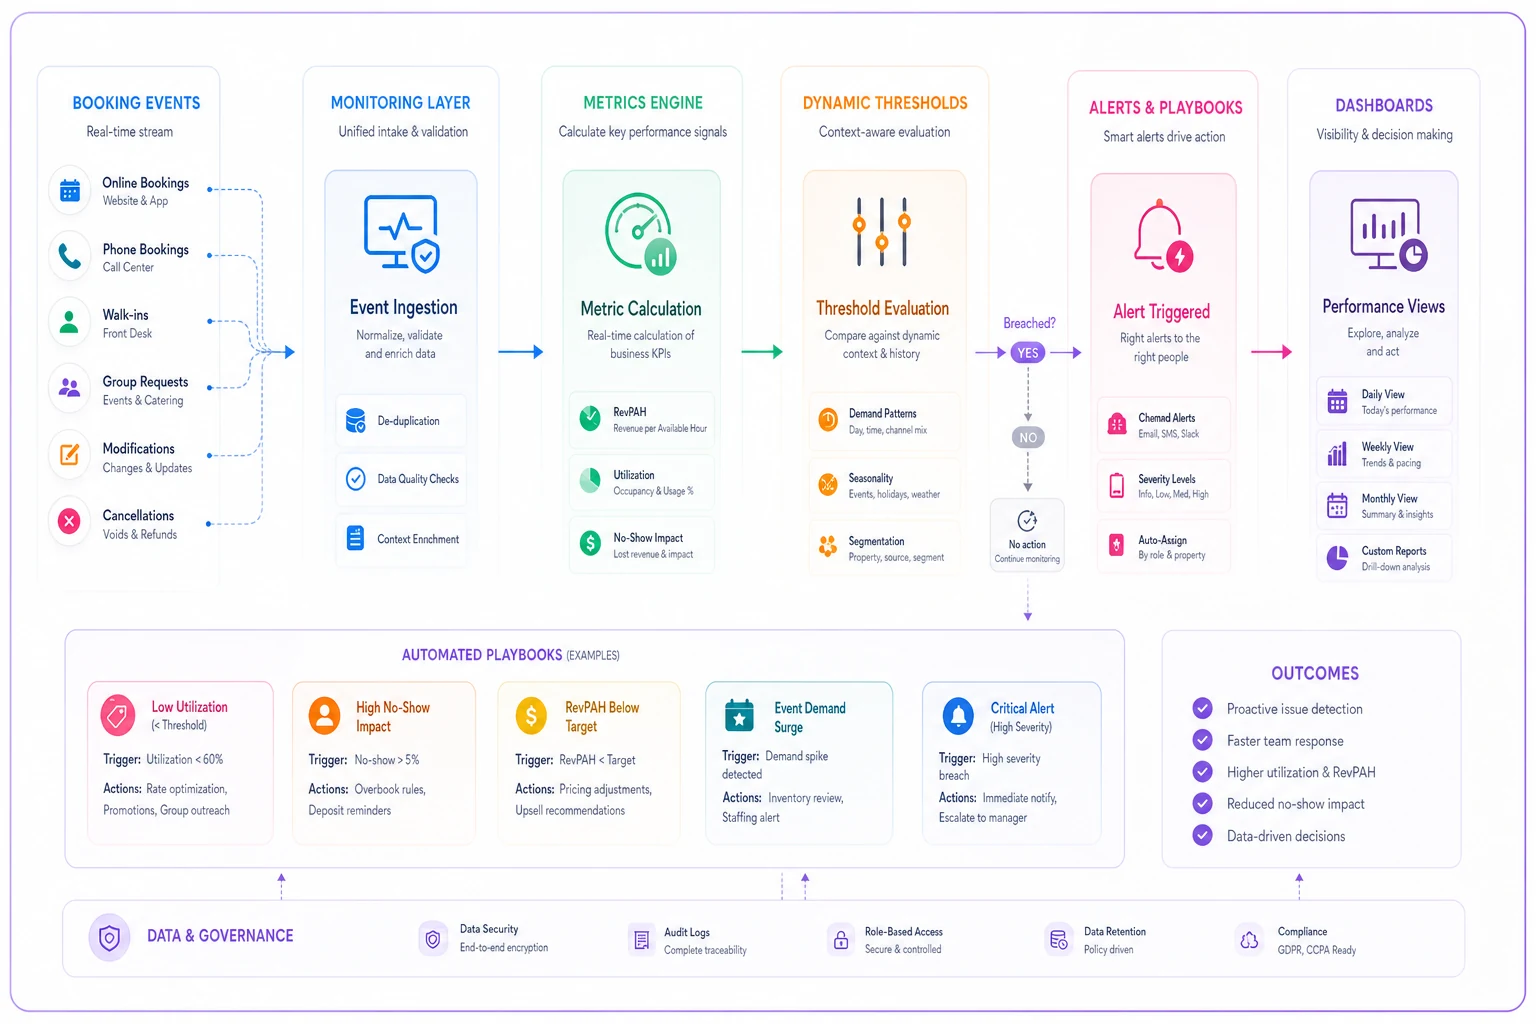
Keep the workflow simple: event capture → metric calculation → threshold evaluation → playbook execution → dashboard visibility.
Instrumentation that captures reality
Most appointment systems track what happened, not why it happened. You need instrumentation that captures operational context.
Event Tracking Beyond Bookings
Standard events everyone tracks:
-
Appointment booked
-
Appointment completed
-
Appointment cancelled
-
No-show recorded
Events that actually explain operations:
-
Reschedule requested (with reason codes)
-
Provider schedule modified
-
Service duration overran
-
Walk-in converted to appointment
-
Waitlist cleared
-
Double-booking override used
-
Deposit waived
-
Reminder sent/failed
Track the full story:
``javascript
trackEvent('appointment.rescheduled', {
originaldate: '2024-01-15',
newdate: '2024-01-22',
reason: 'providerunavailable',
daysnotice: 3,
clienttype: 'regular',
rebookingeffort: 'automated'
});
``
State Transition Tracking
Appointments don't just jump from "booked" to "completed." Track every state transition:
Booked → Confirmed → Reminded → Checked-in → In-service → Completed → Paid
When you track transitions, patterns emerge. Maybe appointments that skip the "confirmed" state have 3x higher no-show rates. Maybe "checked-in" to "in-service" delays over 10 minutes correlate with negative reviews.
Provider State Monitoring
-
Scheduled
-
Available-not-scheduled
-
Break
-
Admin-time
-
Training
-
Out-sick
-
In-service
-
Cleaning/prep
This reveals why 80% schedule utilization still feels understaffed. Providers might be spending 30% of "available" time on prep work nobody is tracking.
Playbook responses that prevent chaos
Metrics without responses just create anxiety. Every threshold breach needs a clear playbook.
No-Show Response Playbooks
Individual Client No-Show (2nd occurrence in 60 days)
-
Flag account for deposit requirement
-
Send personal message (not automated) within 2 hours
-
Offer one-time rebooking at convenience
-
Document reason if provided
If the pattern continues, require full prepayment, limit to same-week bookings only, and consider ending the relationship altogether.
Service Type No-Show Spike (>15% for week)
Diagnostic steps:
-
Check if specific providers are affected
-
Review reminder message timing
-
Analyze booking-to-appointment timeframe
-
Check for external factors (weather, local events)
Immediate adjustments:
-
Add confirmation requirement for this service
-
Adjust reminder schedule
-
Consider overbooking buffer
-
Review deposit policy
Time Slot No-Show Pattern (>20% for specific slot)
Investigation required:
-
Traffic patterns during this time
-
Parking availability
-
Competing local events
-
Client demographic for this slot
Structural changes:
-
Implement slot-specific policies
-
Adjust pricing for high-risk slots
-
Build systematic overbook buffer
-
Consider eliminating the slot entirely
Utilization Response Playbooks
Under-Utilization Alert (<60% for full day)
-
Blast waitlist with limited-time offer
-
Enable online booking for walk-ins
-
Call recent cancellations for fills
-
Post social media availability alert
-
Offer upgrade incentives to existing appointments
Next-day prevention: review tomorrow's schedule gaps, proactively reach out to regulars, and adjust staff scheduling if the pattern persists.
Over-Utilization Alert (>95% for 3+ consecutive days)
Immediate assessment:
-
Check provider stress levels
-
Review service quality indicators
-
Monitor customer wait times
-
Assess front desk overwhelm
Capacity adjustments:
-
Open emergency additional hours
-
Call in part-time providers
-
Tighten service durations
-
Postpone non-essential services
-
Implement booking restrictions
Chronic Mid-Day Utilization Gap (12–2pm <40%)
-
Week 1–2
Discount pricing for gap hours
-
Week 3–4
Express services only
-
Week 5–6
Close for lunch, extend evening
-
Week 7–8
Target a different client segment
Measure impact, implement the winning approach.
Booking Velocity Response Playbooks
Sudden Booking Surge (3x normal for time period)
-
Check for duplicate bookings
-
Confirm payment methods are valid
-
Review for competitor closure
-
Check social media for a viral mention
Capacity management:
-
Implement booking throttle
-
Require deposits for new clients
-
Extend provider hours if possible
-
Activate waitlist overflow
Booking Velocity Collapse (<50% of normal)
Diagnostic checklist:
-
Online booking system functional?
-
Payment processing working?
-
Negative reviews posted recently?
-
Competitor promotion active?
-
Seasonal pattern expected?
Recovery actions:
-
Send re-engagement campaign to dormant clients
-
Offer limited-time booking incentive
-
Review and respond to all recent feedback
-
Audit entire booking flow for friction
Every playbook should be short, testable, and owned by a single role.
The compound effect of operational monitoring
A physical therapy clinic started tracking RevPAH by provider and time slot. They discovered their newest PT had 50% lower RevPAH — not because she was slow, but because the scheduling system defaulted her to 30-minute slots while everyone else got 45 minutes. Simple fix: standardize slot durations. Result: roughly $2,800 in additional monthly revenue.
They also noticed Wednesday 2–4pm consistently showed under 30% utilization across all providers. Instead of running promotions, they converted that window to admin time. Providers used it for documentation, which freed up prime morning slots that had been getting eaten by paperwork. Net effect: 6 additional appointment slots per week at $95 each.
Their no-show tracking surfaced something unexpected: patients scheduled more than 10 days out had 3x higher no-show rates. They added a confirmation requirement for appointments beyond one week. No-shows dropped around 40%, saving roughly $3,400 monthly in lost revenue.
The real power wasn't any single metric. It was the connected monitoring system that revealed operational problems hiding in plain sight.
Common monitoring mistakes that kill accuracy
Measuring Averages Instead of Distributions
"Average appointment value: $75" tells you nothing. You need the distribution:
| Price Range | Share of Appointments |
|---|---|
| $30–45 | 20% (basic services) |
| $46–75 | 45% (standard services) |
| $76–120 | 25% (premium services) |
| $121+ | 10% (specialty services) |
Now you can see that nudging just 10% of standard service clients toward premium has more impact than acquiring new basic service clients.
Ignoring Seasonal Patterns
January gym utilization isn't comparable to July. December salon bookings aren't comparable to February. Build seasonal adjustment factors:
``sql
WITH seasonalfactors AS (
SELECT
EXTRACT(MONTH FROM appointmentdate) as month,
AVG(utilization) as avgutilization
FROM historicalmetrics
GROUP BY month
)
SELECT
currentutilization / sf.avgutilization as adjustedutilization
FROM currentmetrics cm
JOIN seasonal_factors sf ON...
``
Tracking Endpoints Instead of Flows
Monitoring "total appointments" and "total revenue" misses everything in between. Track the full flow:
-
Inquiries → Bookings (conversion rate)
-
Bookings → Confirmations (confirmation rate)
-
Confirmations → Arrivals (show rate)
-
Arrivals → Completions (service completion rate)
-
Completions → Rebookings (retention rate)
Each transition point reveals different operational issues. Drop-off at confirmations is a communication problem. Drop-off at arrivals is a no-show problem. Drop-off at rebookings is a retention problem. They each need different fixes.
Using Static Cohort Definitions
"New vs returning client" is too blunt. Build meaningful cohorts:
| Cohort | Definition |
|---|---|
| First-timers | 1 visit |
| Explorers | 2–3 visits |
| Regulars | 4–10 visits |
| VIPs | 11+ visits |
| Reactivated | Returned after 90+ days gap |
| At-risk | No booking in 45 days |
Each cohort needs different operational handling.
Technology integration and automation opportunities
Manual monitoring breaks down exactly when you need it most — during busy periods. More spreadsheets won't fix that, and neither will complex BI tools that nobody opens after the first week.
Modern appointment platforms can pipe data directly into monitoring systems. Set up event streams that capture every state change, not just final outcomes. When a client reschedules, capture why. When a provider blocks time, capture the reason. When a service runs over, capture the duration variance.
AI-powered operational software handles pattern recognition far better than manual review. Instead of digging through no-show logs every week, a properly configured system can surface things like: Tuesday 3pm appointments with new clients booking less than 24 hours in advance have a 45% no-show rate. That's not a pattern most humans would catch on their own, and it's the kind of insight that changes how you staff and confirm appointments.
The key is connecting monitoring to response automation. When utilization drops below threshold, automatically trigger waitlist notifications. When a regular client no-shows twice, automatically flag the account for a deposit requirement. When booking velocity spikes, automatically tighten confirmation requirements. These aren't complex decisions — they're operational rules that need to execute consistently, every time.
Build escalation logic into your system too. Not every threshold breach needs immediate action. Utilization dropping to 65% on a Monday might be fine — but if it stays there Tuesday, that's worth flagging. One provider at 95% utilization is manageable. Three providers at 95% triggers a capacity review. Smart escalation prevents both alert fatigue and the problems that slip through because everyone assumed someone else was handling it.
Turning monitoring into competitive advantage
Most appointment businesses compete on service quality and price. Operational excellence creates a different kind of advantage. When you can maintain 85% utilization while competitors struggle at 60%, you can invest more in service quality, pay providers better, and still maintain margins.
The real edge isn't the metrics themselves — it's the speed of response. While competitors spend weeks wondering why revenue dipped, you know within hours that Tuesday afternoon no-shows spiked and you've already adjusted. While they're guessing at capacity needs, you're predicting next month's utilization from booking velocity trends.
A well-monitored operation becomes self-improving over time. Each threshold breach teaches you something. Each playbook execution gets refined. After six months, you're not just monitoring the same business better — you're running a fundamentally different operation.
The framework here isn't theoretical. It's based on patterns that repeat across appointment-driven businesses of all kinds. Medical practices use it to drop no-shows from 18% to 7%. Salons use it to increase RevPAH by 30% without adding staff. Consulting firms use it to find and eliminate six figures in annual capacity waste.
Start with one metric. RevPAH is usually the right starting point because it directly connects revenue to capacity. Build your threshold alerts around that single number. Create simple playbooks for when it moves outside normal ranges. Once that becomes routine, add the next metric.
Within 90 days, you'll wonder how you ever ran the business without it. Within six months, operational monitoring feels as essential as your booking system itself. Problems that used to blindside you become predictable patterns with standard responses. That's when appointment scheduling stops being a daily firefight and starts becoming a real competitive advantage.
Ready to optimize your scheduling and operations?
Join thousands of businesses using Schedily to save time, improve coordination, and enhance operational efficiency.